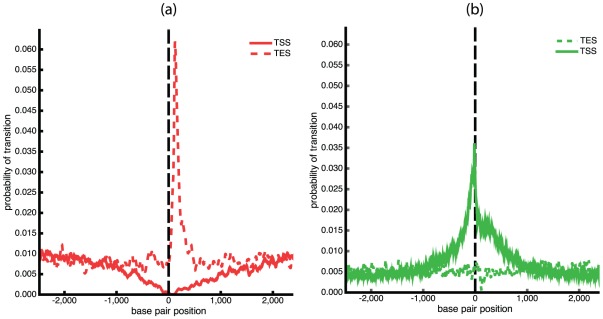
Figure 8. Transition profiles around gene start and end sites.
The average probability for (a) denaturation and (b) Z-DNA formation are shown as functions of base pair position for human gene sequences centered at their transcription start sites (TSSs) and at their transcript end positions (TESs). These calculations were performed at T = 305 K and  = −0.07.

