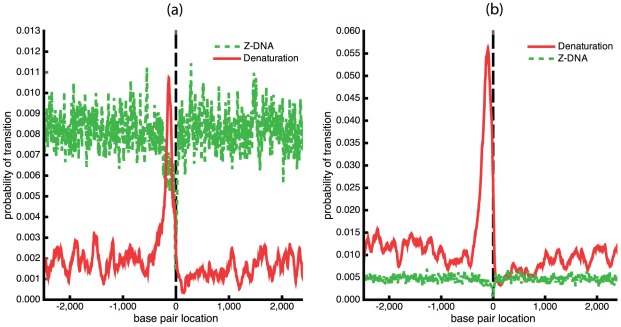
Figure 9. The average transition probabilities for denaturation and Z-DNA at each position relative to the gene start site were calculated at  = −0.07 for 4456 E. coli gene sequences.
The vertical dashed line indicates the gene start site, and transcription proceeds to the right. The competitive transition behavior calculated at  = 305 K is shown in part (a), that calculated at
  = 310 K is given in part (b).

