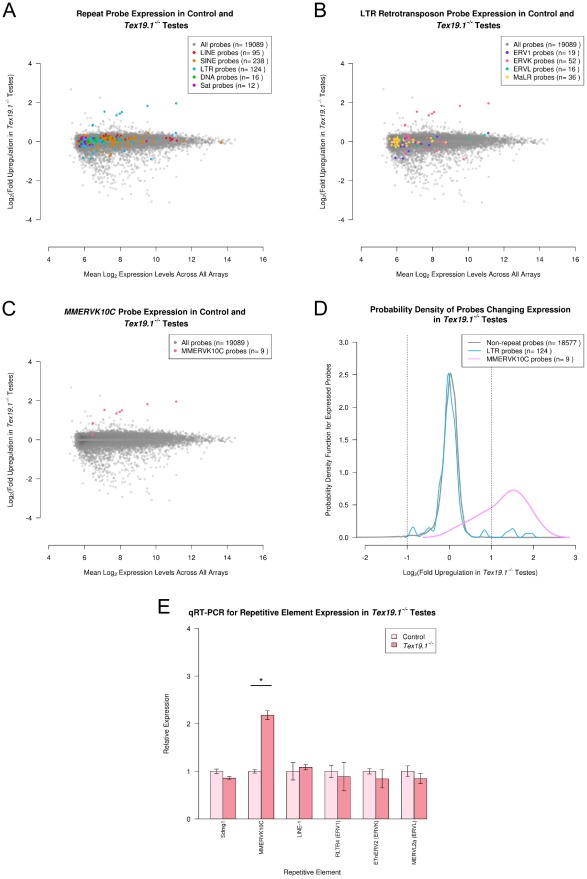
Figure 1. Genome-wide repetitive element expression in Tex19.1−/− testes.
(A–C) MA-plots showing the mean expression level for each expressed probe in the Tex19.1 testis Illumina Beadarray data plotted against the fold upregulation of that probe in Tex19.1−/− testes. Probes for repeat families (A), classes of LTR retrotransposons (B), and the MMERVK10C element (C) are colour-coded in each plot according to the legend. Note the group of six MMERVK10C ERVK LTR retrotransposon probes upregulated in Tex19.1−/− testes. (D) Plot showing the behaviour of the entire MMERVK10C probe population in Tex19.1−/− testes. Vertical lines indicate a 2 fold change. (E) qRT-PCR verification of MMERVK10C upregulation in C57BL/6 Tex19.1−/− testes. Expression levels for each repetitive element (mean ± standard error for three animals) were normalized to β-Actin and expressed relative to littermate controls. Representative LTR retrotransposons belonging to ERV1, ERVK and ERVL classes do not change expression in Tex19.1−/− testes. Sdmg1 is a single-copy control gene for Sertoli cell expression to verify normalization between animals. MMERVK10C env.c and LINE1 ORF2 primer sets (Figure S2) were used to assess MMERVK10C and LINE-1 expression. Asterisk indicates a statistically significant difference (p<0.05).

