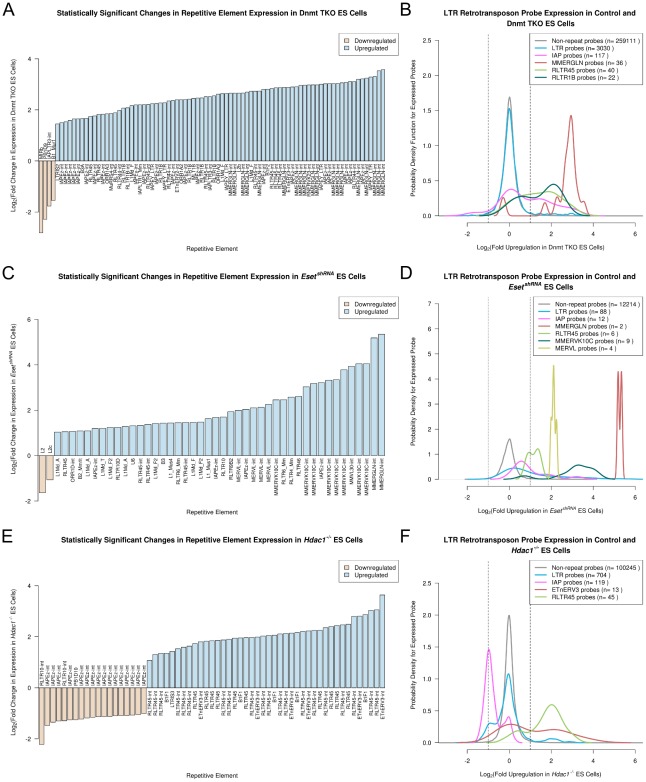
Figure 4. Genome-wide retrotransposon targets of transcriptional repression mechanisms in mouse ES cells.
(A, C, E) Histograms showing repeat probes that change expression at least 2 fold (p<0.01) in Dnmt TKO, EsetshRNA, and Hdac1−/− ES cells respectively. (B, D, F) Plots showing the behaviour of the selected retrotransposon probe populations in Dnmt TKO, EsetshRNA, and Hdac1−/− ES cells respectively. Retrotransposons are colour-coded according to the legend. Vertical lines indicate the 2 fold change cut-off used in panels A, C and E. Note the divergent behaviour of IAP and RLTR45 retrotransposons in Hdac1−/− ES cells in contrast to Dnmt TKO and EsetshRNA ES cells.

