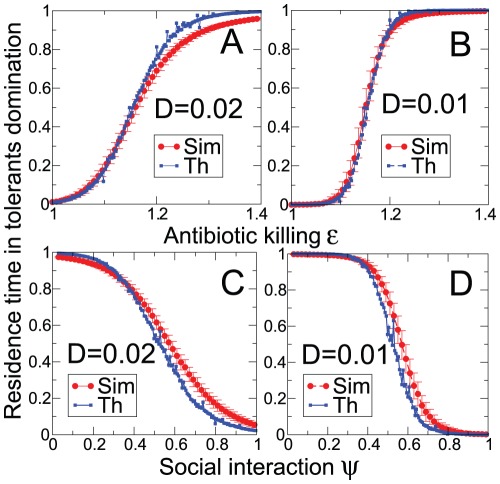
Figure 4. Microbiota resident time in antibiotic-tolerant domination as a function of the: A–B) antibiotic action ( ) and C–D) social interaction (
 ) parameters.
Blue circles show the theoretical predictions obtained by determining the probability of the most probable path. Red circles are obtained by simulating the Langevin dynamics over  iterations and averaged for
  noise realizations. Higher order-corrections can be included to increase the theoretical estimation accuracy.

