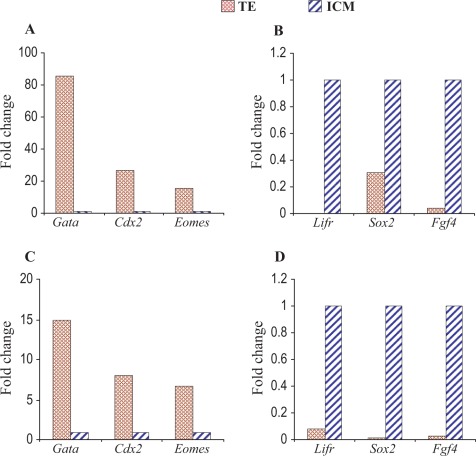
Figure 1.
Microarray validation by quantitative PCR in vivo samples. The PCR data confirmed the microarray results. Upper (A, B) and lower (C, D) panels show the real-time PCR and microarray data, respectively. Left panel (A, C) shows increased expression of Gata 3, Cdx2, and Eomes in TE cells. Expression of Gata 3, Cdx2, and Eomes in ICM samples was normalized to 1. Right panel (B, D) shows increased expression of Lifr, Sox2, and Fgf4 in ICM cells. Expression of Lifr, Sox2, and Fgf4 in TE samples was normalized to 1. PCR indicates polymerase chain reaction; ICM, inner cell mass; TE, trophectoderm.

