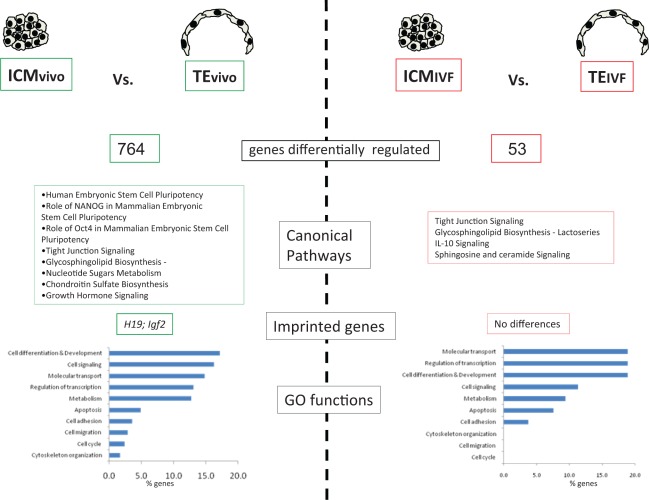
Figure 3.
Difference in pathways and Gene Ontology (GO) functions between TEIVF and ICMIVF and between TEvivo and ICMvivo. The x-axis in the function graph reports the percentage of statistically different gene altered in each class out of the total genes belonging to that particular class. ICM indicates inner cell mass; TE, trophectoderm; IVF, in vitro fertilization.

