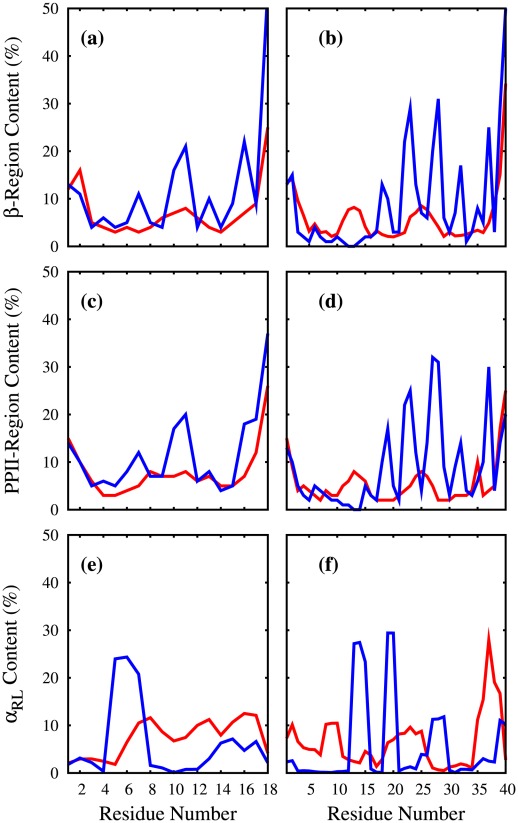
Figure 2.
 , PPII and
  content of selected polyQ peptides.
Here, given are the contents (as a percentage) of individual glutamine residues found in: (a,b)  -region (c,d) PPII-region (e,f)
  . These percentages are plotted against the Glu residue numbers for (a,c,e)
  [red],
  [blue] and (b,d,f)
  [red],
  [blue]. These percentages are obtained from clustering the conformations based on their dihedral angles in the Ramachandran plot.

