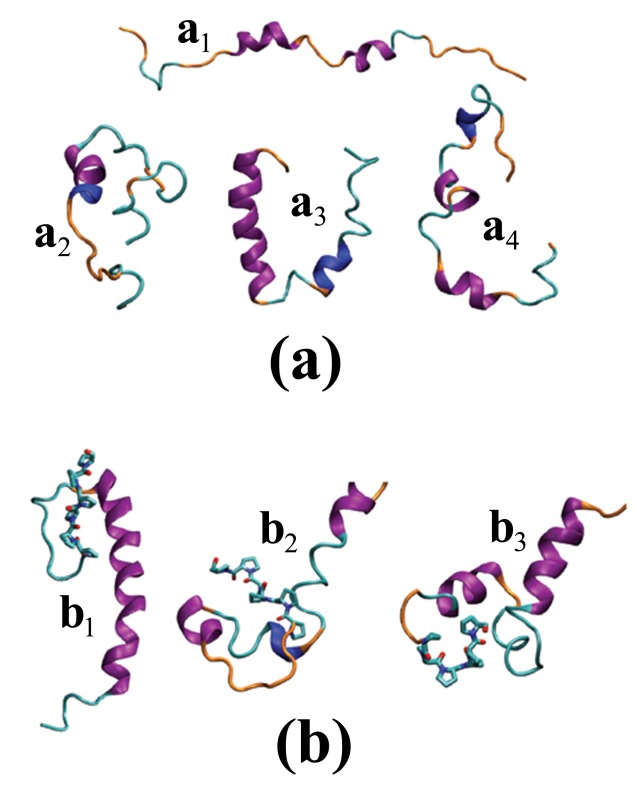
Figure 4. Sample conformations of .
 and
and
 . Cartoon representation of sample conformations of (a)
  and (b)
  . Purple, blue, cyan, and orange represent
  -helix,
  -helix, turn, and coil secondary structural motifs, respectively. The licorice-like representation of the proline segment of
  is given in (b). These structures are plotted by VMD [61] using STRIDE [60] for secondary structure prediction.

