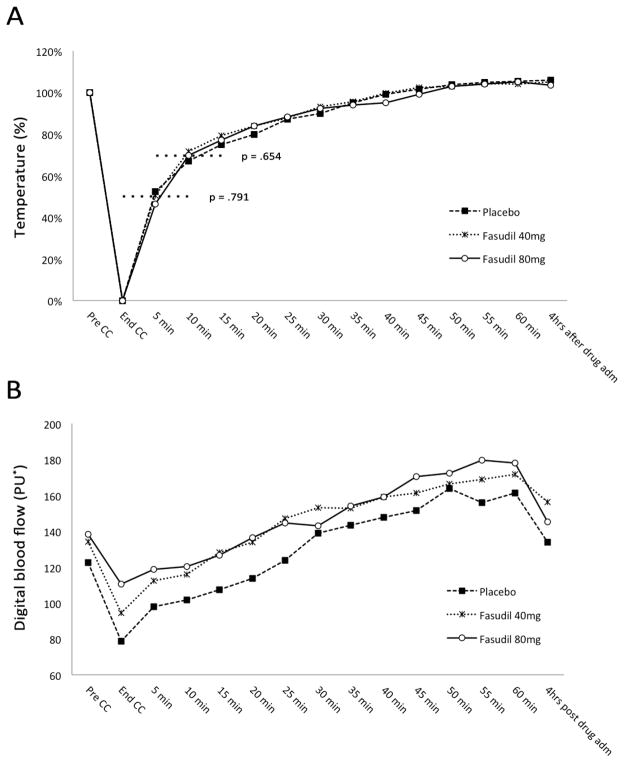
Figure 1. Temperature and digital blood flow curves following single dose fasudil administration versus placebo in SSc patients with Raynaud’s phenomenon.
* Perfusion units (PU) calculated by the instrument accounting for erythrocyte density and velocity in the sampled volume.
CC = cold-challenge; pre-CC = skin temperature measured right before the beginning of the CC; end-CC = skin temperature measured at the end of the CC (CC stopped when digital skin temperature reached 12 °C or the patient could no longer tolerate the cold).
(A) Recovery of digital skin temperature after cold challenge (CC) according to treatment group. Values are expressed as percentage of range from baseline (100%) to minimum digital skin temperature after CC (0%). Times to recover to 50% and 70% (dotted lines) represent the primary outcome.
(B) Mean digital blood flow during and after the cold-challenge (CC) measured with Laser Doppler perfusion imaging according to treatment group (values are reported in Table 2).

