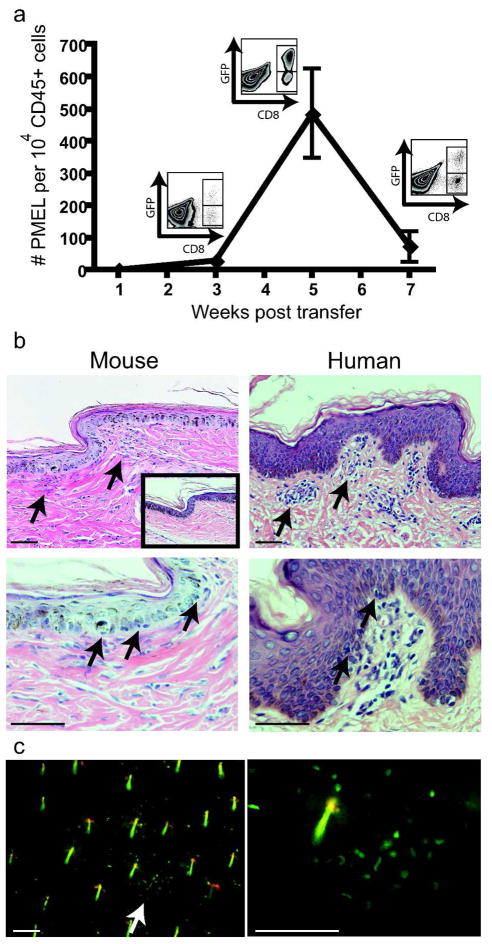
Figure 2. T cells accumulate in the skin during vitiligo.
(a) GFP-labeled CD8+ T cells were quantified by flow cytometry of ear skin at the indicated times (error bars = mean +/− SEM, n=3 per time point). Example flow plots of the CD45+ gate are shown. (b) Tail skin from affected mice harvested 5 wks after transfer (mouse) is shown with affected skin from a vitiligo patient (human), revealing a patchy mononuclear infiltrate at the dermal-epidermal junction and epidermal infiltration (arrows). Normal mouse skin is shown at inset, scale bars=50μm. (c) Ears were harvested from mice with vitiligo at 5 wks after induction and GFP+ T cells were visualized with fluorescent microscopy (arrow). Scale bars=100μm. Hairs are visible as short, linear yellow structures due to autofluorescence.

