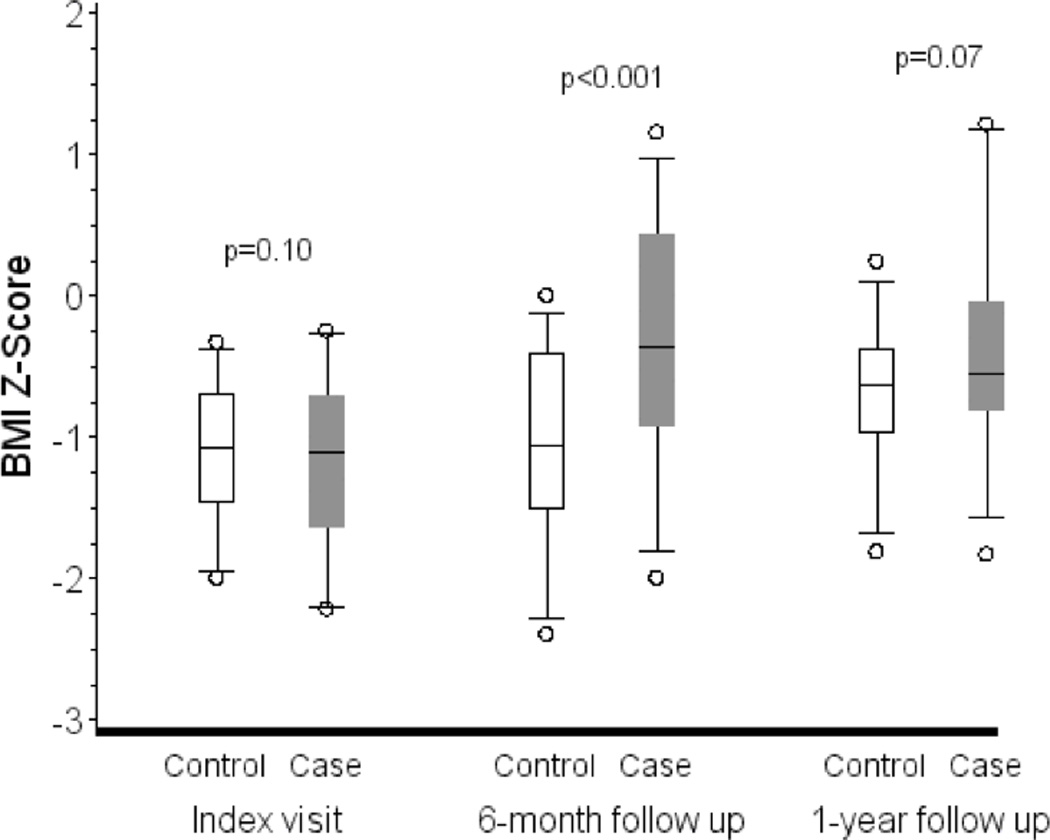
Figure 1.

BMI Z-scores by visit and case-control status. The boxes represent the median and interquartile ranges, and the whiskers are the 5th and 95th percentiles. The p-values are from paired t-tests of the difference between the cases and controls in Z-scores at the index visit and the change from the index visit to the follow-up visits.
