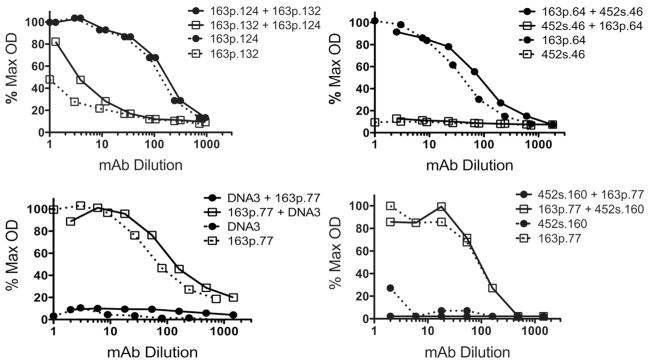
Figure 1.
Supernatant mAbs that do not bind BM when assayed alone do not bind BM when combined with supernatant mAbs that do bind BM. Supernatant mAbs from the indicated hybridoma pairs were assayed by direct ELISA for BM binding. Titration curves represent serial dilution of supernatants assayed independently for IgG2a or IgG2b binding to BM: solid circles, IgG2a; open squares, IgG2b; solid lines, IgG2a and IgG2b mAbs co-incubated; and broken lines, IgG2a or IgG2b mAb incubated alone. Supernatant concentrations of mAbs: 163p.124, 12.1 μg/ml; 163p.132, 34.7 μg/ml; DNA3, 29.1 μg/ml; 163p.77, 23.5 μg/ml; 163p.64, 10.0 μg/ml; 452s.46, 6.4 μg/ml; and 452s.160, 18.7 μg/ml. Maximum OD405 = 2.600.

