Figure 1.
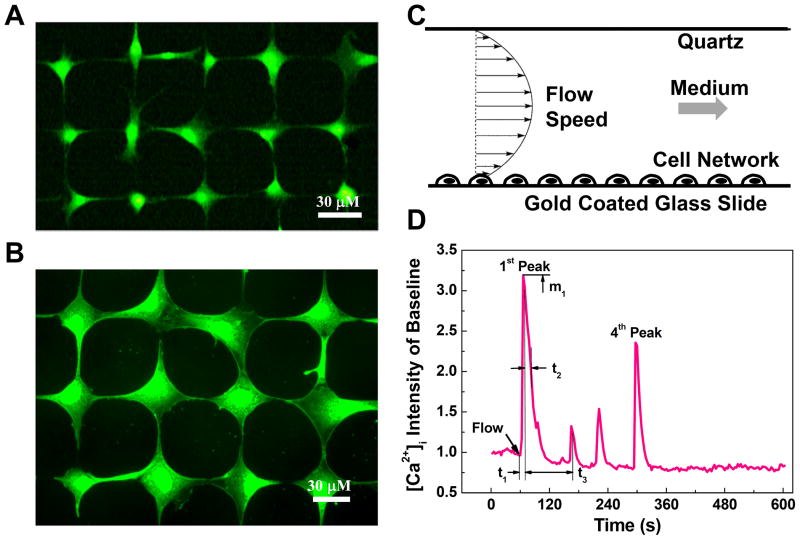
Micro-patterned bone cell networks, laminar fluid flow stimulation, and the definition of spatiotemporal parameters to characterize the [Ca2+]i transients. Fluorescent images show typical well-formed (A) MLO-Y4 and (B) MC3T3-E1 cell networks. The cells were loaded with Fura-2 AM to indicate intracellular calcium ions. Each cell attaches on a round island on micro-patterned slides. The island is 15 μm in diameter for MLO-Y4 and 20 μm for MC3T3-E cells. Scale bars in both images are 30 μm. (C) The slide with patterned cell network was mounted in a laminar fluid flow chamber. The laminar flow rate was controlled by a high-resolution magnetic gear pump to generate 0.5, 1, 2, or 4 Pa shear stress on the cell surface. (D) The calcium responses of cell networks were recorded for ten minutes: one minute for baseline and nine minutes during fluid flow stimulation. The [Ca2+]i intensity was represented by averaging image intensity inside a normalized cell over baseline level. Number of [Ca2+]i peaks, magnitude of 1st peak m1, time to 1st peak t1, relaxation time of 1st peak t2, and time interval between 1st and 2nd peaks t3 were defined here using a typical [Ca2+]i transient of MC3T3-E1 cell.

