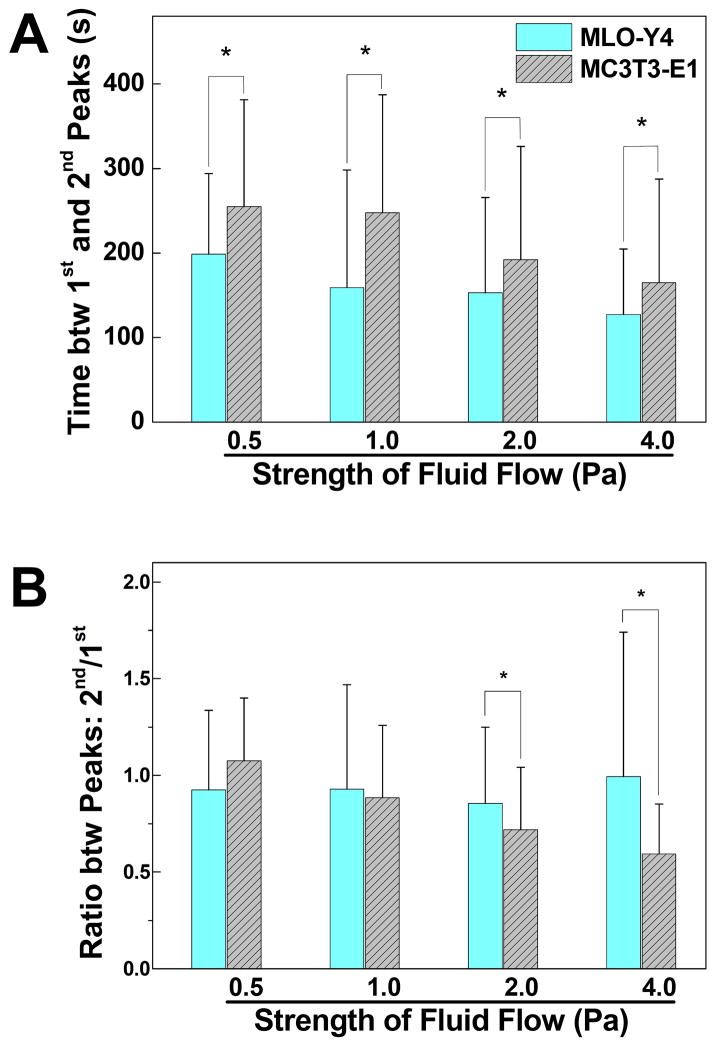
Figure 3.
Comparison of the spatiotemporal characterization of the 2nd peaks in [Ca2+]i responses. Only cells with more than one [Ca2+]i peak were counted. (A) Time gap between the highest magnitudes of the 1st and 2nd [Ca2+]i peaks. (B) The magnitude ratio between 2nd and 1st [Ca2+]i peaks. Data shown are mean ± std dev. * = statistically significant difference between two types of cells at a specific fluid flow strength, P<0.05.

