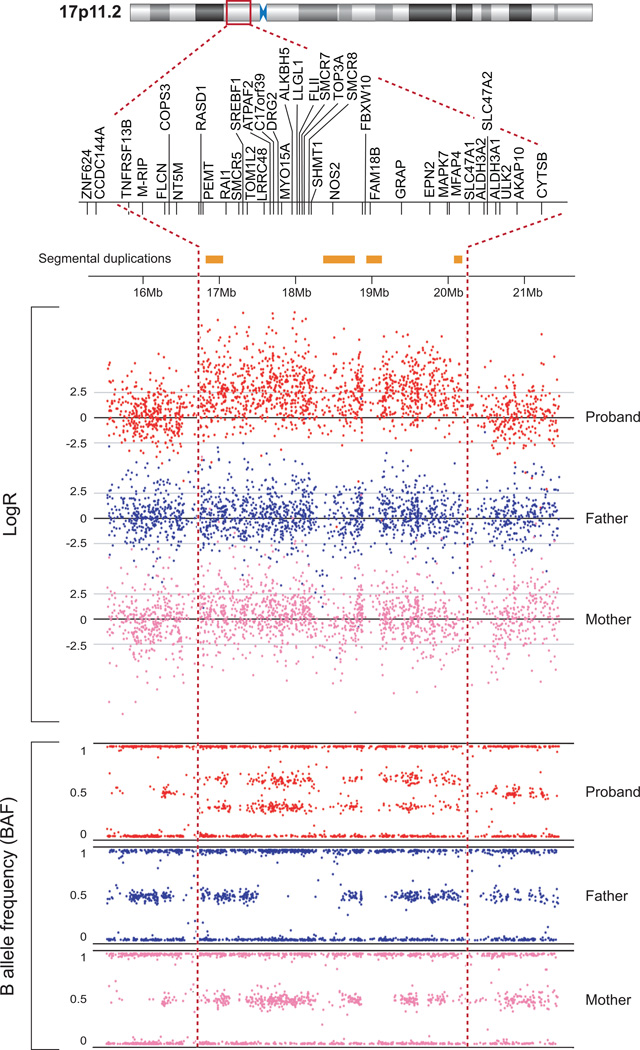
Figure.
Figure shows duplication at 17p11.2 at positions 16,497,803 and 20,292,768 bp of build NCBI36/hg18. The increase in the log R ratio values (log R ratio zero represents diploid copy number and increased log2 ratios represents duplicated regions) and the split in the B allele frequencies (BAF; allelic composition) plotted for each SNP.

