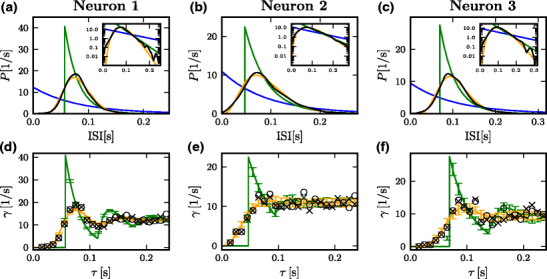
Fig. 2.

Inter-spike-interval density and auto-correlation function. (a)–(c) Estimated probability density of the inter-spike-interval (ISI, kernel density estimation with Gaussian kernel) of a neuron (black), ISI density of the Poisson process (1) with rate  , d = 0 (blue), ISI density of the PPD matched to the mean (
 ) and standard deviation (
 ) of the neural ISI (green) using Eq. (6), ISI density of gamma process matched to
  and
and  (orange, see Appendix A). The inset shows the same data on a logarithmic scale. (d)–(f) Auto-correlation functions of single spike trains. Theoretical result (8) for the PPD (green curve), numerically computed auto-correlation of gamma process (8) (blue curve), in vivo data (black crosses), shuffled in vivo data (black circles), estimate of mean and standard deviation from repeated realization of PPD and gamma processes of the same duration as the neural recording (error-bars, colors as in (a)–(c)). Same parameters and data as in (a)–(c). The left, middle, and right column correspond to neurons 1, 2, and 3, respectively
