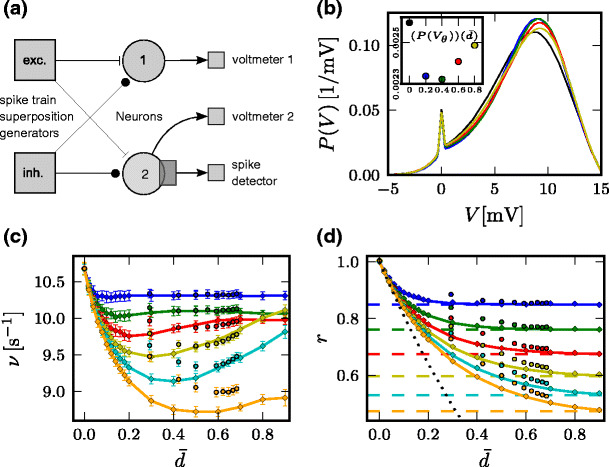
Fig. 5.

Effect of refractoriness in the input activity on integrate-and-fire model neurons. (a) Scheme of the simulation. PPD superposition generators produce excitatory and inhibitory input to the neurons. Neurons in population 1 do not have a spiking mechanism, we record the free membrane voltage without threshold and reset. Neurons in population 2 are spiking LIF neurons used to simulate the firing rate and the membrane distribution in the presence of the threshold. (b) Estimate of the stationary distribution of the membrane potential of population 2 (kernel density estimation with Gaussian kernel) with 1/μ = 14 s − 1. Color denotes dead-time  of input component processes, (back, blue, green, red, yellow):
  (0, 0.2, 0.4, 0.6, 0.8) (ms). The inset shows how the value of the density at the spiking threshold depends on
  . (c) Firing rate ν of the LIF neurons (population 2) depending on the effective dead-time d of the component input processes, keeping the mean ISI and the total input rate constant. Simulation results are obtained using PPD superposition generators (diamonds) and gamma process superposition generators (circles). The colors distinguish different rates 1/μ of the input component processes, (blue, green, red, yellow, cyan, orange): 1/μ =(5, 8, 11, 14, 17, 20) (s − 1). To maintain the same total rate of input spikes for different rates of the component input processes, the number of superimposed processes was adjusted accordingly, see Eq. (33) and text. Error-bars denote the standard deviation of the rate across simulated neurons. (d) Reduction r of the variance of the free membrane potential (population 1) relative to the case of Poisson input. Theoretical result (29) as solid curve. Limits for infinite component rate (dotted line, Eq. (30)) and for fully regular input components (dashed lines, Eq. (32)); color and symbol code as in (c). Remaining parameters are given in Table 2
