
Figure 3.
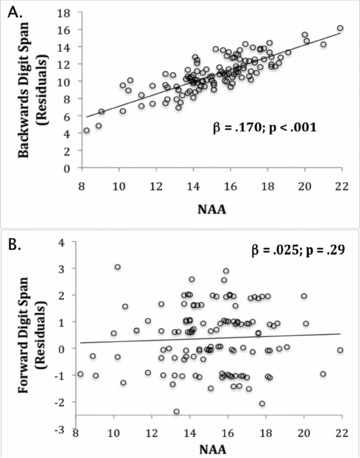
Relationship between NAA and digit span lengths. (A) Scatterplot of the linear relationship between NAA and the residuals of the backwards digit span bootstrap regression model after controlling for education, sex, Cr, and a quadratic trend in the span lengths. (B) Scatterplot of the null relationship between NAA and the residuals of the forward digit span bootstrap regression model after controlling for education, sex, and Cr.