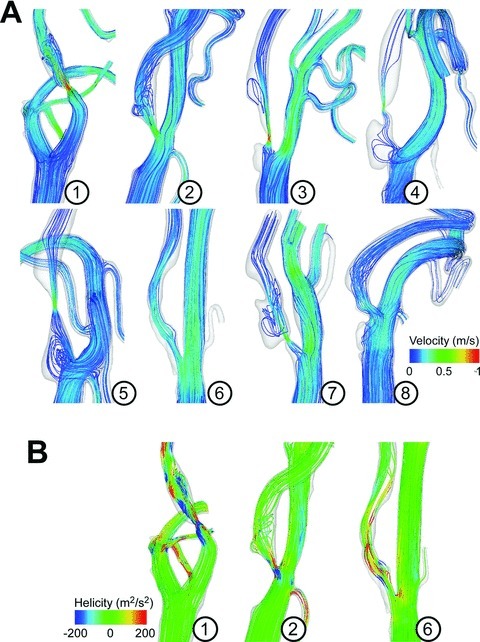
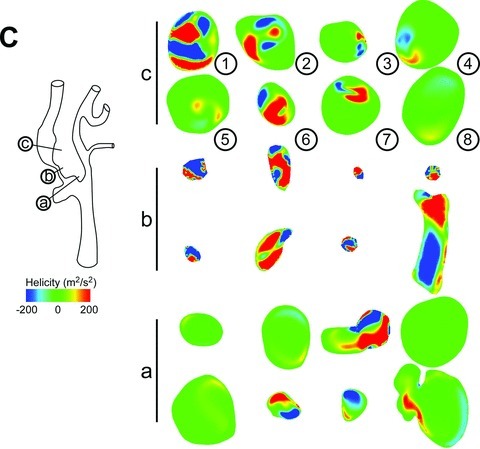
Figure 1.


(A) Pathlines color coded for the time-averaged velocity magnitude. (B) Examples of pathlines, color coded for the helicity density. (C) Helicity density on orthogonal cutplanes that correspond to a prestenotic cutplane a (see schematic), a cutplane at the throat of the stenosis b, and a cutplane in the poststenotic region (PSR) c.
