
Figure 2.
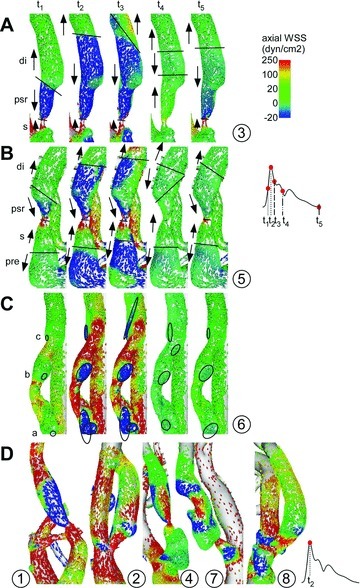
(A–C) Three example (case 3, 5, and 6) detailing the temporal evolution of the instantaneous wall shear stress (WSS) vectors at the stenosis and poststenotic region (PSR) during the cardiac cycle (reds points on pulse wave). Regions of antegrade or retrograde axial WSS direction (pre, s, di, psr, di) are demarcated by lines that demonstrate the stepwise changes of the location of the zone of shearreversal between these regions. WSS vortices are outlined (circles a–c) at the wall as it migrates in a cyclic fashion during the cardiac cycle. (D) Instantaneous WSS vectors at peak-systole in cases 1, 2, 4, 7, and 8.