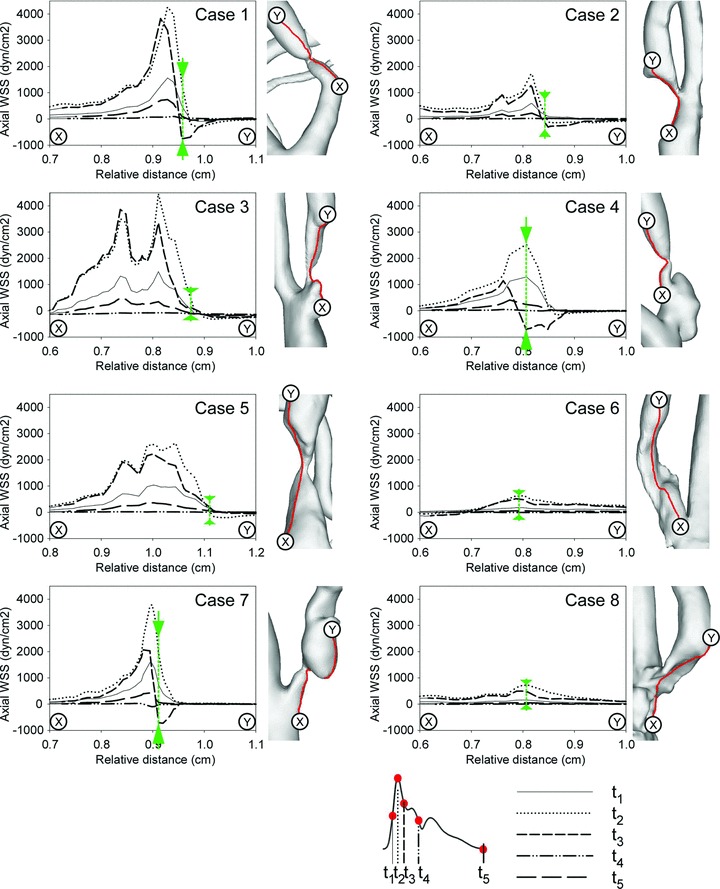
Figure 3.

Axial wall shear stress (WSS) magnitude along the line between points X and Y (see schematic on right of each panel) during five points of the cardiac cycle. Green arrows demarcate the point of maximal shear reversal during the cardiac cycle.
