
Figure 2.
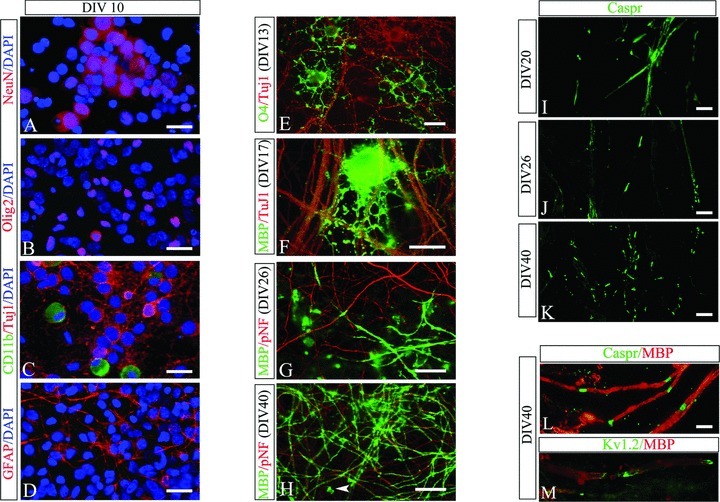
Characterization of myelination culture derived from E16 rat spinal cord. Neurons and glia were identified using their specific markers at DIV10. The major cells types are neurons (A, NeuN+) and OL lineage cells (B, Olig2+), representing more than half of total cells. Microglia/macrophage (C, CD11b+) and astrocytes (D, Glial fibrillary acidic protein [GFAP]+) were mostly found in the periphery of cover slips. Progression of OL maturation and myelination was identified using specific lineage markers. OL progenitor cells (O4+) were highly branched and showed close contact with neurites at early stage (E). At DIV17, premyelinating mature OLs (myelin basic protein [MBP]+) extended their processes and started to wrap around neurites (F). By DIV26, substantial myelin segments, shown as MBP/phosphorylated neurofilament H (pNF) double-labeled lines, were found in the culture (G). Myelination reaches its peak around DIV40 when dense MBP/pNF-labeled axons were shown (H). At this stage, OL cell bodies were only occasionally seen (arrow head in H). The myelination process can also be revealed by the formation of the node of Ranvier. The paranodal protein Caspr initially showed a diffuse pattern of expression on surface of axons at the onset of myelination (I), but became progressively clustered at the nodal region when myelination was active or at its peak (J and K). Higher power view shows the regular spacing of internodes (MBP+) by paranodal domains (Caspr+ in L) or juxataparanodal domains (Kv1.2+ in M). Scale bar: 25 μm (A–H); 10 μm (I–M).