
Figure 3.
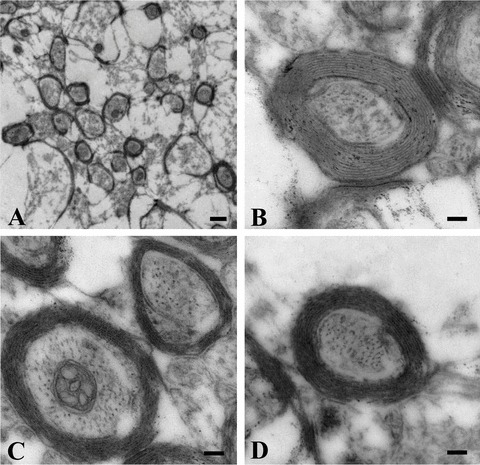
Ultrastructural characteristics of myelination in the spinal cord derived cultures at DIV40. (A) Low power view reveals the distribution of myelinated axons in the culture. Three representative high power photographs show the typical appearance of myelinated axons with extensive myelin sheath wrapped around an axon (B–D). Scale bar: 100 nm (A), 500 nm (B–D).