
Figure 7.
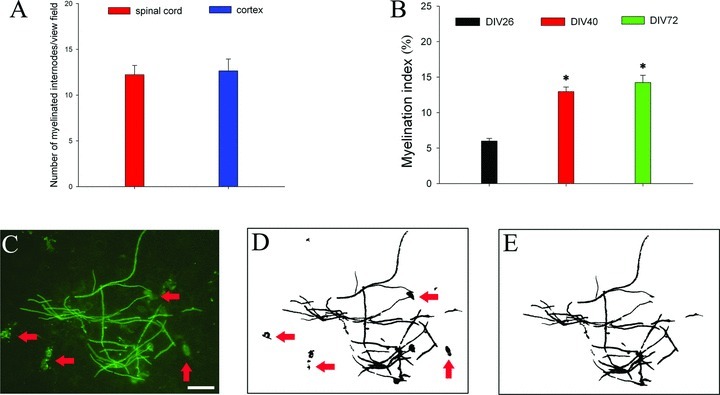
Quantification of myelination. At DIV26, the number of myelin segments was manually counted and further compared between cortex derived cultures and spinal cord-derived cultures, and no significant difference was found between these two cultures (A). At DIV40 or later, when myelin segments were too dense to count, an alternative approach was adopted by calculating the ratio of areas occupied by myelin segments to that of the entire image, and the ratio is defined as myelination index (%). The myelination index was significantly higher at DIV40 compared to DIV26 (*P < 0.05), but no changes were found at later course (B). (C–E) denote how the myelin segments were quantified using ImageJ. (C) is the original image taken for ImageJ analysis (no adjustment), (D) is the image generated by ImageJ outlining the area occupied by myelin basic protein (MBP)+ signals after adjusting the threshold, and (E) is the same image after manually erasing areas occupied by OL cell bodies to leave only myelin segments available for analysis. * P < 0.01 vs. DIV26. Scale bar: 25 μm.