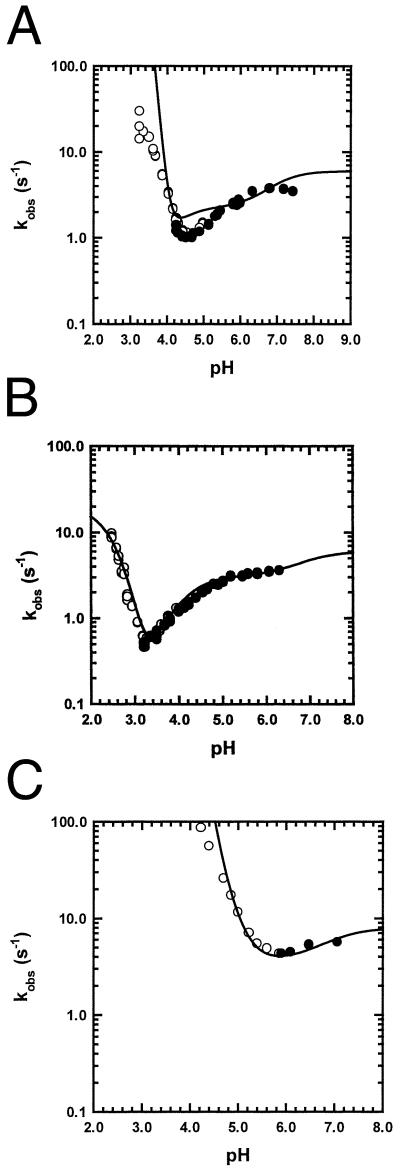
Figure 3.
The plot of log kobs vs. pH in 10 mM acetate buffer at 4.5°C for WT (A), H24V/H119F (B), and H36Q (C). All three curves are fitted with same pKa values (Table 1), which are also used to fit the data in citrate buffer (Fig. 2), with reference values ku = 2 × 10⁻⁵, kf = 6 (A), ku = 2 × 10⁻⁶, kf = 6 (B), ku = 5 × 10⁻⁴, and kf = 8 (C). The rate constants are given in s−1, and the reference values refer to pH 9.

