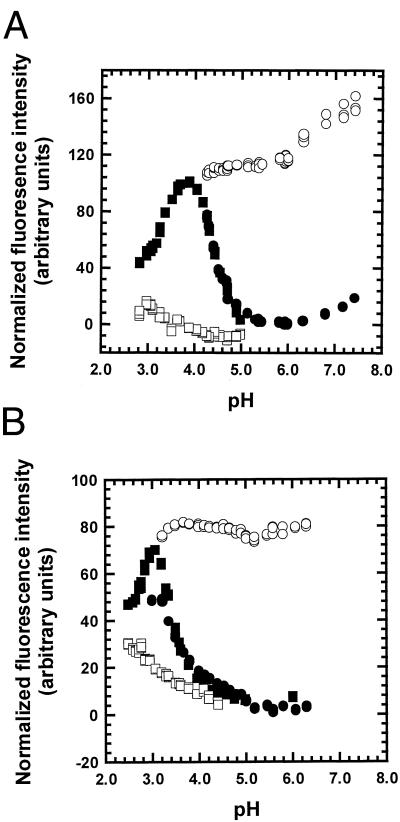
Figure 4.
The kinetic amplitudes of the unfolding and refolding experiments shown in Fig. 3 A and B. Open symbols are initial values, filled symbols are final values. Circles are refolding starting from pH 4.2, and squares are unfolding starting from pH 6.0. The fluorescence data are normalized so that the final fluorescence is 0 at pH 6.0 and 100 at pH 4.2. The fitted curves are equilibrium pH unfolding curves, which yield two of the pHm values shown in Table 2

