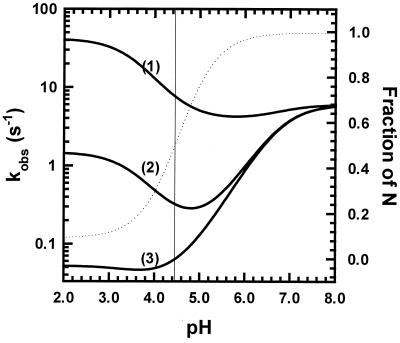
Figure 5.
Simulation of the values of kobs vs. pH for a simple model (see text) in which only one ionizing group has pKa values that differ in I, I‡, and N. The pKa value in I‡ differs in the three cases shown: case 1, 6.6 (close to I); case 2, 5.15 (intermediate); case 3, 3.7 (close to N). The pKa value in N is 3.5 and in I is 6.8 in all three cases. The fraction unfolded is shown on the right y axis, and the dotted line is the equilibrium unfolding curve (unfolding does not go to completion at low pH) calculated from the values of ku and kf vs. pH (see Experimental Procedures). Their values at pH 9 are ku = 0.001 s−1 and kf = 6 s−1.

