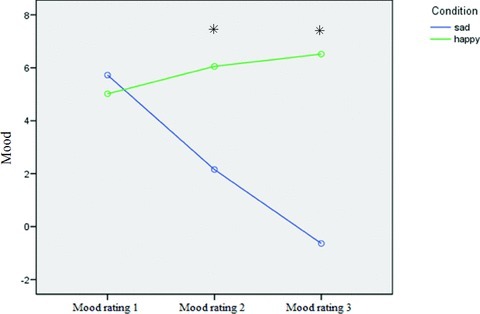
Figure 3.

Differences between mood induction groups in self-ratings of mood before and after the two mood inductions. Mean scores for the sad and happy mood groups are shown for baseline mood rating (1), first postmood induction rating (2), and second postmood induction rating (3).
