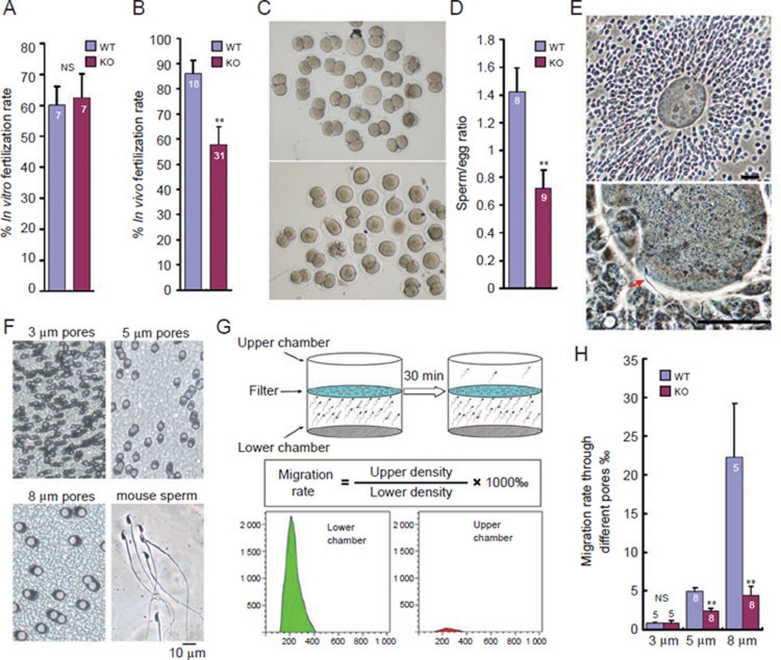
Figure 4.
Aqp3−/− male shows reduced in vivo fertilization due to impaired sperm migration into oviduct. (A, B) In vitro (A) and in vivo (B) fertilization tests for wild-type and Aqp3−/− sperm (NS: P > 0.05, **P < 0.01, t-test). (C) Representative pictures of embryos flushed from wild-type female oviduct (day 2) after mating with wild-type and Aqp3−/− male. Each picture shows embryos collected from two females. (D) Aqp3−/− sperm shows reduced number in reaching egg-cumulus complex in vivo (**P < 0.01, t-test). (E) Demonstrative figures of egg-cumulus complex (upper) and arrived sperm as indicated by red arrow (lower). Scale bars: 50 μm. (F) Actual size of different pores (3, 5 and 8 μm diameter) in filter membranes (10 μm thick) used for in vitro sperm migration assay. (G) Illustration of in vitro sperm migration assay through filters with different pores and calculation of migration rate. (H) Migration rate for wild-type and Aqp3−/− sperm (released from cauda epididymis) through different filters (NS: P > 0.05, **P < 0.01, KO vs WT, t-test). Numbers within or above the bars indicate number of mice used for each assay. All error bars represent s.e.m.

