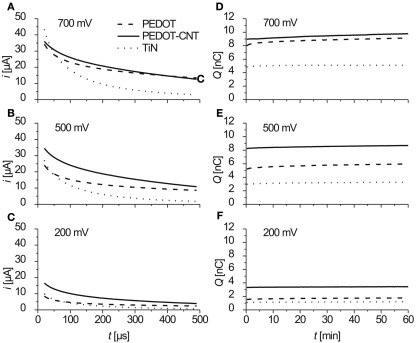
Figure 6.
(A–C) Anodic part of the current response to biphasic anodic first voltage pulses at three different amplitudes. Data show mean values of current traces over 1 h (3.6 million pulses), recorded four times a minute (n = 240). (D–F) Charge/pulse delivered (anodic part) as recorded during 1 h of constant pulsing (mean of current integrals, n = 4).

