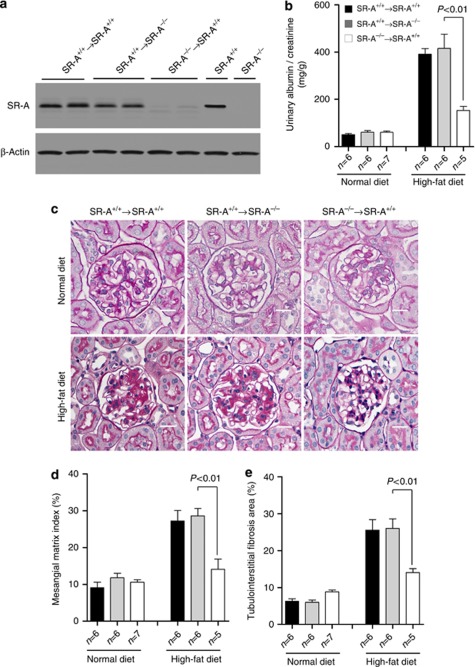
Figure 8.
Albuminuria and renal histology in BMT uninephrectomized mice at 16 weeks of dietary intervention. (a) Representative western blot analyses of SR-A expression in circulating leukocytes. (b) Urinary albumin/creatinine. (c) Representative histological photomicrograph of kidney stained for glomerular mesangial matrix (periodic acid–Schiff stain). Scale bar=19 μm. (d) Bar graph summarizing the mesangial matrix index (MMI) in periodic acid–Schiff–stained section. (e) Bar graph summarizing the percentage of tubulointerstitial fibrosis area in trichrome-stained section. Each bar represents the mean±s.e.m. for at least six mice. BMT, bone marrow transplantation; SR-A, scavenger receptor A; SR-A+/+, SR-A wild-type mice; SR-A−/−, SR-A deficiency mice.

