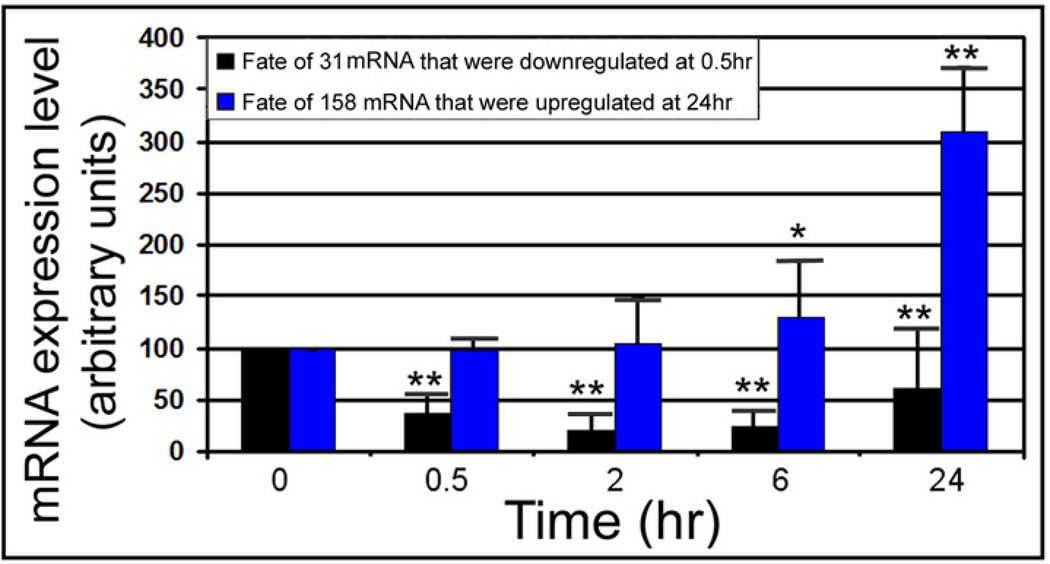
Figure 2.
Of highly changing genes, downregulated genes decrease rapidly and remain significantly lower than unstressed and upregulated genes increase slowly, becoming significantly higher by 24hr. Time courses of the 31 genes downregulated at 0.5hr and 158 genes upregulated at 24hr are displayed in a histogram series. ** Signifies highly significant change (p<0.001), and * signifies significance (p<0.05). Y error flags show standard errors of average intensity of the group.

