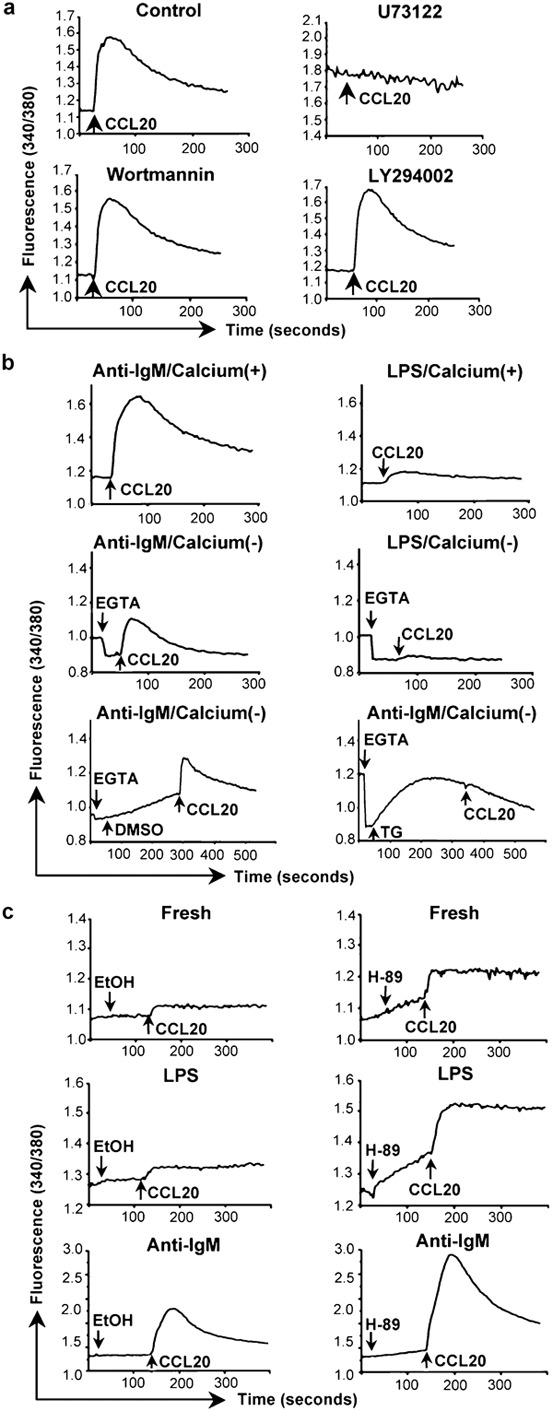
Figure 2.

Mediators and sources of chemokine-induced calcium signals in B cells. (a) Calcium flux in mouse splenic B cells that had been incubated for 2 days with 10 µg/ml anti-IgM F(ab')2 was measured as in Figure 1b in response to additions of CCL20. Cells were pretreated for 10 min at 37 °C with the concentrations of inhibitors as noted, or with 0.2% of DMSO as a vehicle control, the cells were washed, and chemokine was added (indicated by the arrows). One representative experiment is shown out of two performed using all inhibitors. Additional experiments were done using some of these inhibitors with similar results. (b) Calcium flux in mouse B cells treated with anti-IgM F(ab')2 or LPS as in Figure 1a was measured as in Figure 1b in response to additions of CCL20 (indicated by the arrows). The top panels show cells in HBSS containing 1.3 mM calcium. The middle panels show cells in HBSS without calcium to which 1.6 mM EGTA was added (indicated by the arrows) before addition of CCL20. The bottom panels show cells in HBSS without calcium to which was added 1.6 mM EGTA and either 0.04% DMSO as a vehicle control or 1 µM TG (indicated by the arrows) before addition of CCL20. One representative experiment is shown out of two performed. (c) Calcium flux in mouse splenic B cells that had been either freshly isolated (top panels), or incubated for 2 days with 50 µg/ml LPS (middle panels) or 10 µg/ml anti-IgM F(ab')2 (bottom panels) was measured as in Figure 1b in response to additions of CCL20 following additions of either 0.625% ethanol as a vehicle control or 25 µM H-89 (indicated by the arrows). Addition of H-89 led to rising baselines before addition of CCL20. One representative experiment is shown out of two performed for all conditions. Additional experiments were done for some conditions with similar results. LPS, lipopolysaccharide; TG, thapsigargin.
