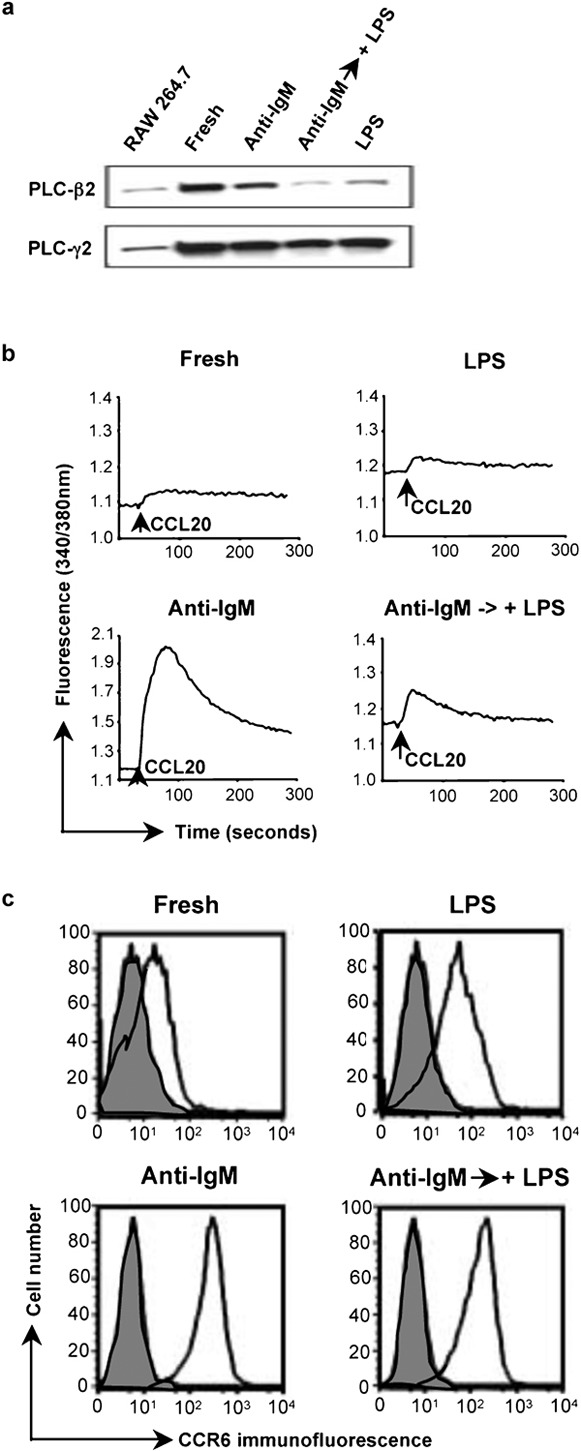
Figure 4.

LPS downregulates the level of PLC-β2 and chemokine-induced calcium signals in B cells that had been activated with anti-IgM. (a) Lysates of mouse B cells treated with anti-IgM F(ab')2 or LPS as in Figure 1a, or after a 1-day incubation with 10 µg/ml anti-IgM F(ab')2 followed by a 1-day incubation with 50 µg/ml LPS were analyzed by western blot as in Figure 3b. A lysate of the RAW 264.7 mouse macrophage cell line was included as a positive control/marker for detecting PLC-β2. The amounts of protein loaded for the RAW 264.7 cells were not matched to the B-cell samples. Probing for PLC-γ2 was for determining loading of B-cell samples. The PLC-β2 band was positioned between protein markers of 210 kDa (myosin) and 131 kDa (β-galactosidase), with an apparent molecular mass, on this gel, of 150 kDa. (b) Calcium flux for the same B cells as in (a) was measured as in Figure 1b in response to additions of CCL20 (indicated by the arrows). (c) Surface expression of CCR6 is shown for the same B cells as in (a). Shaded histograms are of cells incubated with normal rabbit IgG and open histograms are of cells stained with antimouse CCR6. CCR6 was detected using PE-conjugated F(ab')2 goat anti-rabbit IgG. Analysis was done on a FACSCalibur flow cytometer (BD Biosciences). One representative experiment is shown out of two performed. LPS, lipopolysaccharide; PE, phycoerythrin; PLC, phospholipase C.
