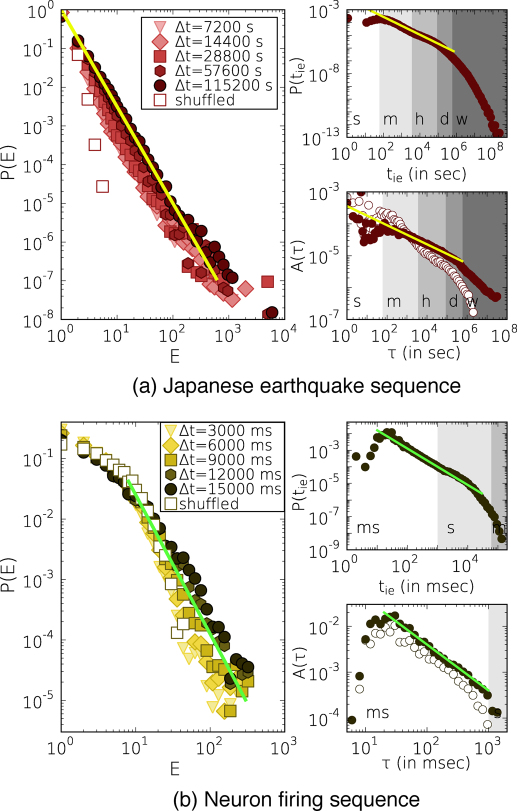
Figure 3. The characteristic functions of event sequences of natural phenomena.
The P(E) distributions of correlated event numbers with various Δt time-window sizes (main panels), P(tie) distributions (right top panels) and average autocorrelation functions (right bottom panels). (a) One station records of Japanese earthquake sequences from 1985 to 1998. The functional behavior is characterized by the fitted power-law functions with corresponding exponents  ,
,  and
and  . Inter-event times for P(tie) were counted with 10 second resolution. (b) Firing sequences of single neurons with 2 millisecond resolution. The corresponding exponents take values as
  ,
,  and
and  . Empty symbols assign the calculation results on independent sequences. Lanes labeled with ms, s, m, h, d and w are denoting milliseconds, seconds, minutes, hours, days and weeks respectively.

