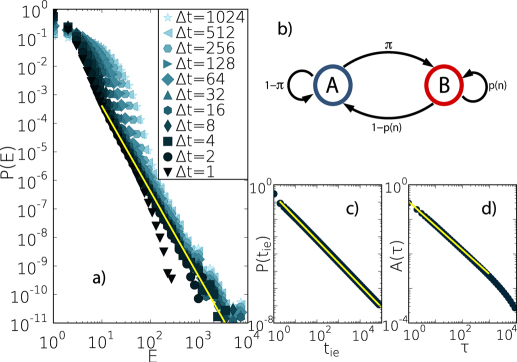
Figure 5. Schematic definition and numerical results of the model study.
(a) P(E) distributions of the synthetic sequence after logarithmic binning with window sizes Δt = 1…1024. The fitted power-law function has an exponent β = 3.0. (b) Transition probabilities of the reinforcement model with memory. (c) Logarithmic binned inter-event time distribution of the simulated process with a maximum interevent time  . The corresponding exponent value is γ = 1.3. (d) The average logarithmic binned autocorrelation function with a maximum lag τmax = 104. The function can be characterized by an exponent α = 0.7. Simulation results averaged over 1000 independent realizations with parameters µA = 0.3, µB = 5.0, ν = 2.0, π = 0.1 and T = 109. For the calculation we chose the maximum inter-event time
  , which is large enough not to influence short temporal behavior, but it increases the program performance considerably.

