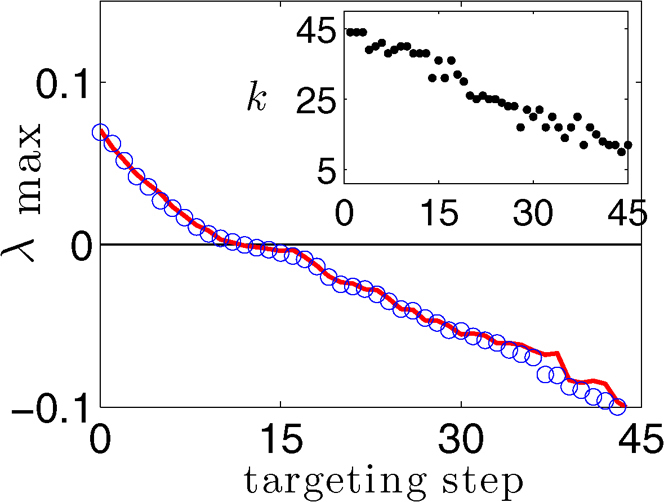
Figure 2. Suboptimal vs. degree ranking.

Targeting procedure applied to a N = 50 network of Rössler oscillators (see the main text and the Methods section for details on the graph construction and on the ranking procedure). λmax extracted from the MSF as a function of the targeting step, for the suboptimal sequence (blue open circles), and with the node degree sequence (red continuous line). The inset shows the degree k of each pinned node in the suboptimal sequence, vs. the targeting step.
