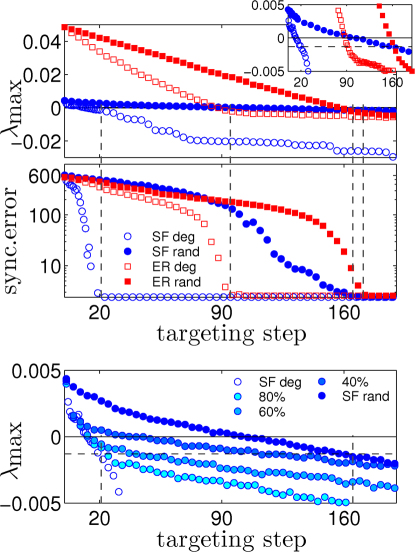
Figure 3. Targetability of different topologies.
(Top and middle panels) Targeting scheme for ER and BA networks of size N = 500. λmax (top panel) and synchronization error (middle panel, see Methods Section for definition) as functions of the targeting step, for the degree and random rankings. The legend applies to both panels, and contains the symbol codes for the specific topologies considered, as well as for the specific ranking used for the targeting. The vertical dashed lines originating in the middle panel mark the targeting step at which the synchronization error vanishes. The inset of the top panel is a zoom around λmax = 0. The horizontal dashed line in the inset of the top panel marks the negative value at which the vertical lines intersect the λmax curves. (Bottom panel) Robustness of the targeting strategy against networks' uncertainties. The panel reports the λmax curves vs. the targeting step for the BA network used in the top and middle panels. The different curves refer to the degree ranking (empty circles), the random ranking (full circles with the darkest blue intensity), and a degree ranking based on the knowledge of the degrees of only 80%, 60% and 40% of randomly selected nodes in the network. These latter three curves are coded as full circles with increasing blue intensities.

