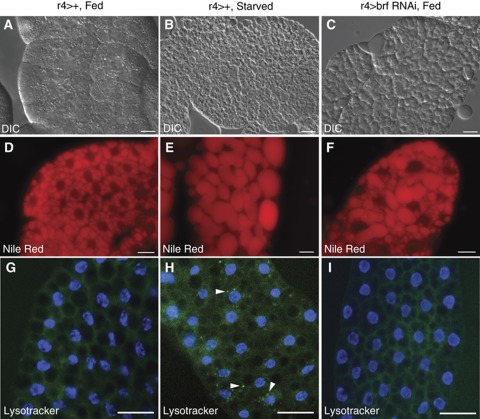
Figure 3.
The fat body-specific loss of Brf function phenocopies some aspects of the starvation response. Fat bodies were dissected from 72 h larvae and stained with Nile Red to visualize lipid droplets or lysotracker green to vizualize autophagosomes. (A–C) DIC and (D–F) Nile Red images of fat bodies isolated from control (r4>+) fed (A, D) and control 24 h starved larvae (B, E). (C, F) Fed larvae with fat body-specific reduction in Brf levels (r4>brf RNAi) are shown. (G–I) Lysotracker green images of fat bodies isolated from control fed (G) and r4>brf RNAi (I) larvae show no lysotracker staining. Starved control larvae exhibit a punctuate staining pattern (H, arrowheads) caused by the formation of autophagosomes. Images were all taken at the same exposure. Scale bars, 100 μm.

