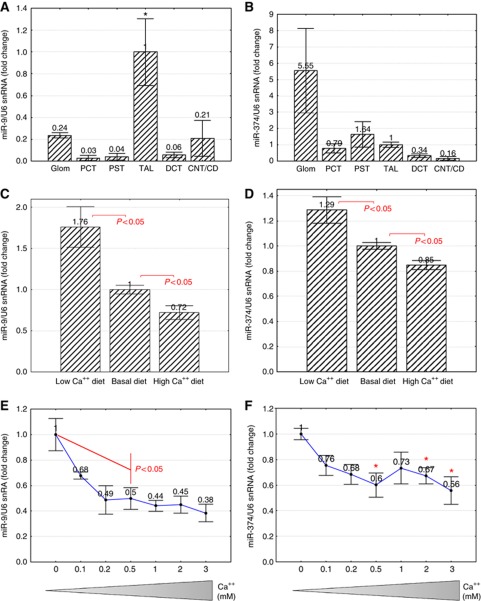
Figure 6.
Extracellular Ca++ regulation of microRNAs in the kidney. (A) miR-9 and (B) miR-374 transcript levels relative to U6 snRNA transcript levels in microdissected tubular segments. *P<0.05, n=3. (C) miR-9 and (D) miR-374 transcript levels in mouse kidney TALs receiving dietary Ca++ variations. (E) miR-9 and (F) miR-374 transcript levels in MKTAL cells cultured in 0–3 mM Ca++.

