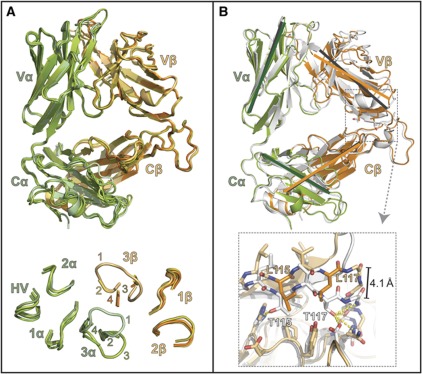
Figure 7.
Comparison of the iNKT TCR structure between J24.L17 unliganded and liganded, and that of the iNKT TCR co-crystallized with CD1d–αGalCer. (A) Alignment of the complexed J24.L17 iNKT TCR with that of the three uncomplexed J24.L17 iNKT TCRs derived from our studies. The complexed iNKT TCR is coloured in light green (α chain) and light orange (β chain) as in other figures; the uncomplexed iNKTs are coloured in related shades. No major domain shifts are noted between the complexed and uncomplexed TCRs. The CDR loop conformations; no major shifts are seen between the CDR1, CDR2 loops of the α and β chains, or for the HV4α loop are shown at the bottom. Electron density was poor for all uncomplexed CDR3β loops; these loops are shown truncated. Electron density was also poor for two of the three unliganded CDR3α loops; they are shown truncated as well. The loops are labelled according to the TCRs to which they correspond: 1=complexed iNKT TCR; 2=uncomplexed iNKT TCR from the complexed data set; 3=iNKT TCR (1) from the uncomplexed data set; and 4=iNKT TCR (2) from the uncomplexed data set. Electron density for the main-chain atoms of the CDR3α loop of #3 was continuous and positioned this loop in an alternate conformation from that of the liganded CDR3α loop. (B) Alignment of the LPC-specific iNKT TCR with that of iNKT TCR from the αGalCer complex structure (Pellicci et al, 2009) (PDB#3HUJ). αGalCer iNKT TCR is shown in white, LPC iNKT TCR is shown in green (α chain) and orange (β chain); these were aligned based on the Cα and Cβ main-chain CA carbons. Grey lines represent the orientation of the Ig domains that make up the αGalCer iNKT TCR core structure and green and orange lines represent the Ig domains from the LPC iNKT TCR; lines were drawn from identical atom locations on each TCR. Black lines were drawn similarly and shown the pivot point of the Vβ domain in relation to the Vα, Cα and Cβ domains. At bottom is a magnified view of the C-terminal residues of the Jβ segment, side- and main-chain atoms contributing to the shift are shown as stick representation, LPC β-chain residues as orange, αGalCer β-chain residues shown in white. Hydrogen bonds contributing to this interaction are shown as dashed yellow lines: highly likely H-bonds (>3.3 Å) are shown with heavy dashed lines, probable H-bonds (4 Å> but >3.3 Å) are shown as light dashed lines. A 4.1-Å shift is apparent in the main-chain CA carbons between the two TCRs within this region.

