Figure 1.
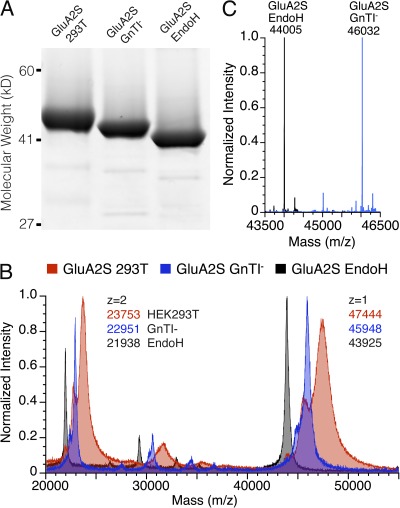
Analysis of GluA2 preparations varying in extent of glycosylation. (A) SDS-PAGE showing approximate masses of 45.3, 44, and 41.5 kD for GluA2S expressed in 293T cells (left lane), GnTI− cells (middle lane), and after digestion with EndoH (right lane). (B) Overlay of MALDI-TOF spectra for the same preparations illustrating singly (z = 1) and doubly (z = 2) charged species. (C) Overlay of deconvoluted ESI spectra for GluA2S GnTI− samples before and after digestion with EndoH.

