Figure 4.
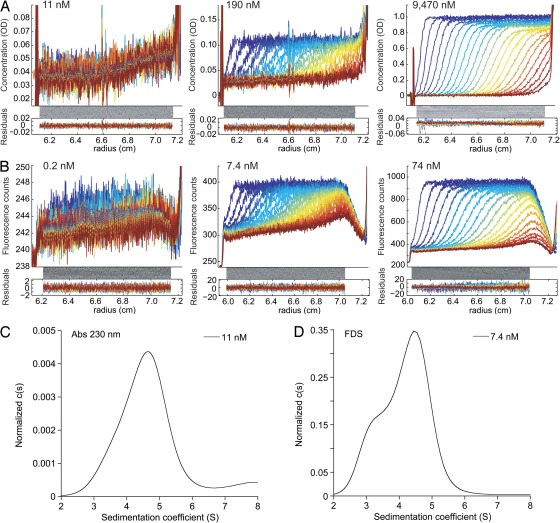
Representative raw SV data at different GluA2 concentrations measured using absorbance and fluorescence detection. (A) Data for GluA2S measured by absorbance at 230 nm. (B) Data for EndoH-digested FAM-labeled GluA2S measured using fluorescence detection; the data shown form part of the sw isotherm shown in Fig. 3 D. In both panels, the radial signal distributions are shown at equidistant time points after start of the centrifugation, with later times indicated by higher color temperatures on a blue < green < red scale. (C) c(s) distribution obtained from the analysis of the 11-nM data of GluA2S shown in A. Integration and Monte-Carlo analysis leads to an sw value of 4.46 S (4.16–4.56 S). (D) For comparison, analogous c(s) distribution of FAM-labeled GluA2S at 7.4 nM derived from FDS data, leading to an sw value of 4.14 S (4.06–4.26 S).

