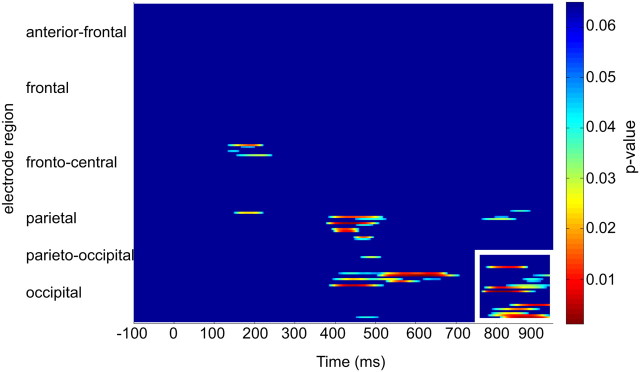
Figure 6.
Paired t tests of all electrodes and all time points across auditory and visual conditions (corrected for multiple comparisons). Parieto-occipital electrodes outlined in white show significant (p < 0.05) difference across the two conditions from 780 to 940 ms after S1. Significant differences were also observed for a few parietal electrodes from 400 to 700 ms, but distinct topographical shifts were not observed for this time period.

