Figure 1.
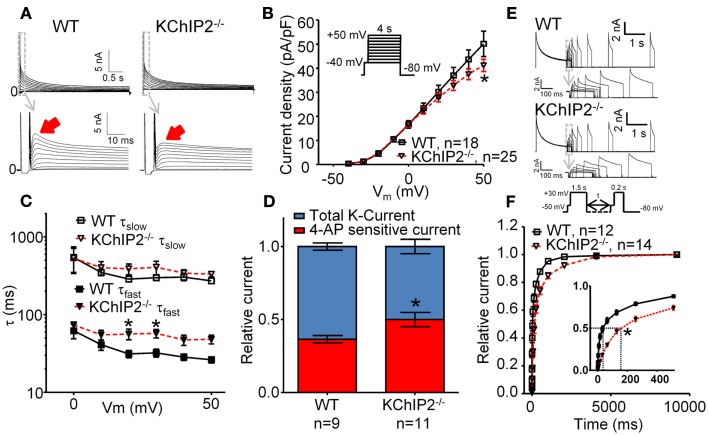
Whole-cell voltage-clamp recordings of outward K-currents recorded in disaggregated left ventricular cardiomyocytes from wild-type (WT) versus KChIP2−/− mice. Cardiomyocyte isolation and patch-clamp solutions (37°C) were made according to (Brouillette et al., 2004) with minor modifications. Cadmium (300 μM) was added to inhibit L-type Ca2+ currents. (A) Representative current traces showing that KChIP2−/− cardiomyocytes lack a fast decaying component of the outward K-current (solid arrows). (B) Peak current density as a function of test potential, however, was not significantly changed at any voltage (inset, voltage protocol). (C) The decay of the outward current (0–700 ms) was fitted to a second-order exponential function to obtain time-constants (τ) of inactivation for positive test potentials. No differences between WT and KChIP2−/− were found for the slow component; however, the fast component of the current decay was significantly slower for KChIP2−/− myocytes, confirming the loss of a transient component. (D) In order to dissect IK,slow1 from Ito,f, the current sensitive to 100 μM 4-AP was determined. The 4-AP sensitive fraction (red) of the peak current (blue, normalized to 1) was increased in KChIP2−/− compared to WT, indicating increased IK,slow1. (E) Recovery from inactivation was addressed by a double-pulse voltage-clamp protocol with varying interpulse intervals (see inset). Representative current traces from WT and KChIP2−/− cardiomyocytes are presented. (F) The mean recovery from inactivation is illustrated as the peak current during the 0.2-s test pulse relative to the 1.5-s base pulse. Recovery from inactivation was significantly slowed in KChIP2−/− compared to WT in interpulse intervals between 1 and 4000 ms. This is compatible with a larger fraction on the outward potassium currents attributable to IK,slow relative to Ito,f in KChIP2−/− cardiomyocytes. Data are reported as mean ± SEM. Statistical significance was evaluated by ANOVA followed by Newman–Keuls’ post hoc test where appropriate. *p < 0.05. Comparable data have been published previously by Thomsen et al. (2009b).

