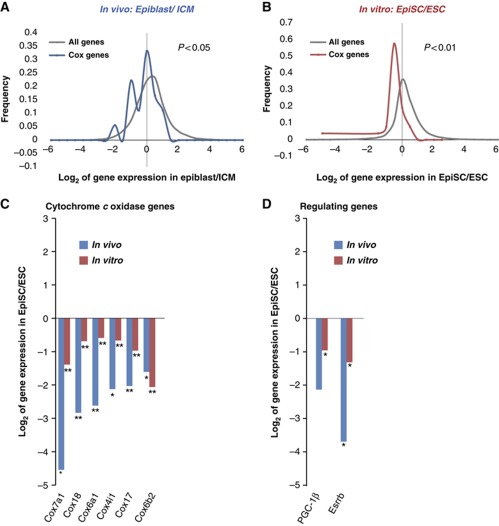
Figure 5.
Deep RNA-sequence analysis of freshly dissected inner cell mass and epiblast reveals high similarity in mitochondrial COX gene expressions in vivo and in vitro. Expression levels of COX genes only are compared with that of all genes in the in-vivo data set (A) and in the in-vitro data set (B) to illustrate the downregulation of COX genes (in vivo: P<0.05; in vitro: P<0.01). (C) The comparison of the most significantly downregulated COX genes in-vivo and in-vitro data is shown. (D) High correlation of in-vivo and in-vitro data in the expression levels of PGC-1β and Esrrb is shown. Biological triplicates were used for each embryonic stage, the lysate comprised ∼50 embryos in each experiment. *Indicates P<0.05, ** indicates P<0.01.

