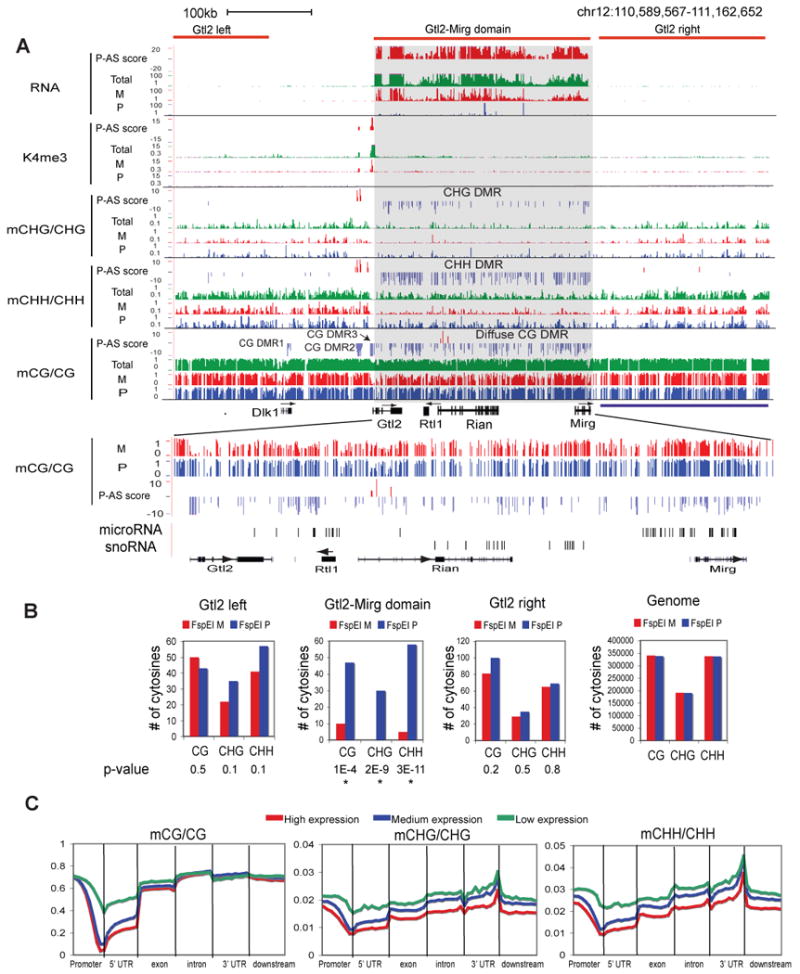
Figure 4. Parent-of-origin dependent non-CG methylation in the mouse frontal cortex.

(A) Total and/or allelic levels of RNA, K4me3, CHG methylation, CHH methylation and CG methylation, together with their P-AS scores, are shown for the Dlk1-Gtl2-Mirg domain (top). CG DMRs (DMR1-3 and the diffuse CG DMR) and non-CG DMRs are indicated. A zoomed-in region for the Gtl2-Mirg domain is shown with the locations of microRNA and snoRNA genes indicated (bottom). (B) The numbers of CGs, CHGs and CHHs corresponding to FspEI cut sites on the maternal and paternal alleles in the Gtl2 domain, two regions nearby (“Gtl2-left” and “Gtl2-right”) or the entire genome are shown as bar graphs. The p-values for the allelic bias (binomial distribution) are also shown (“*”, p-value < 0.01). (C) The average methylation levels for CG, CHG and CHH are shown along the promoter (2.5kb upstream of TSSs), 5′UTR, exon, intron, 3′UTR and downstream regions (2.5kb downstream of TESs), for all RefSeq genes with high (top 1/3, red), medium (middle 1/3, blue) and low (bottom 1/3, green) levels of expression (FPKM values, average of F1i and F1r). See also Figure S5.
