
Figure 1.
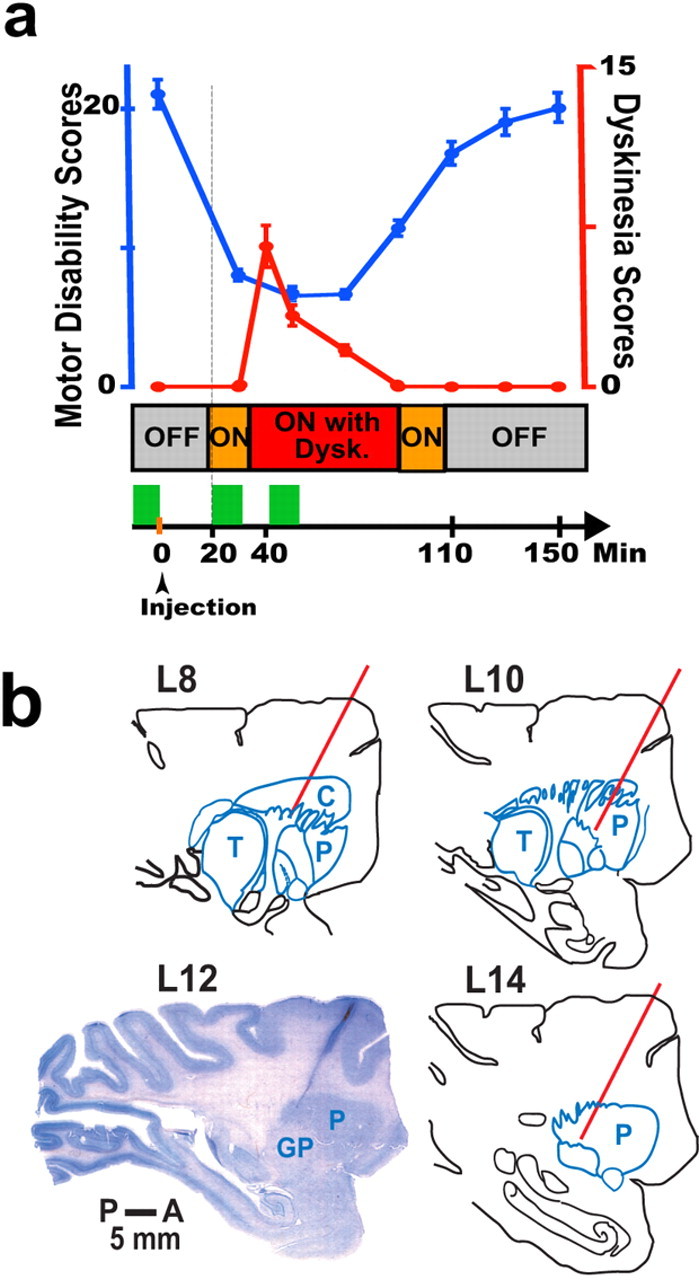
Motor behavior, timetable of experiments, and recording sites. a, The top graph shows motor disability (blue curve; left y-axis) and dyskinesias (Dysk.; red curve; right y-axis) that were scored with the standardized motor disability scale (data points represent the mean, and error bars denote SEM). The middle stack bar shows the monkey's transition to motor states during the experiment (Off, On, and On with dyskinesias) (see Materials and Methods). At the bottom, the sequence of procedures is represented by a horizontal arrow that is plotted synchronously with the top graph and the middle stack bar, as indicated by the vertical line. Green blocks denote collection of neural data (9–12 min) starting in the Off state, and again in the On state (usually 20 min after the subcutaneous injection of levodopa), and finally during the peak of dyskinesias (usually after 40 min from levodopa injection). Experiments of lower doses of levodopa that did not induce dyskinesias (not plotted for clarity) followed the same timetable and neural data collection in each state. b, The Nissl-stained section of the monkey brain shows the electrode track of a brain penetration made just before the animal was killed. To show one of the recording sites, the electrode track was placed at the posterior and lateral area of the putamen. The section matched the anatomy of lateral 12 in the sagittal plane of the monkey atlas (L12). The position of other electrode penetrations was confirmed with reference to the coordinates of the electrode track in L12, and they are represented by red lines in the drawings of corresponding sections according to the atlas. The bar shows the scale from posterior (P) to anterior (A). C, Caudate; P, putamen; GP, globus pallidus; T, thalamus.