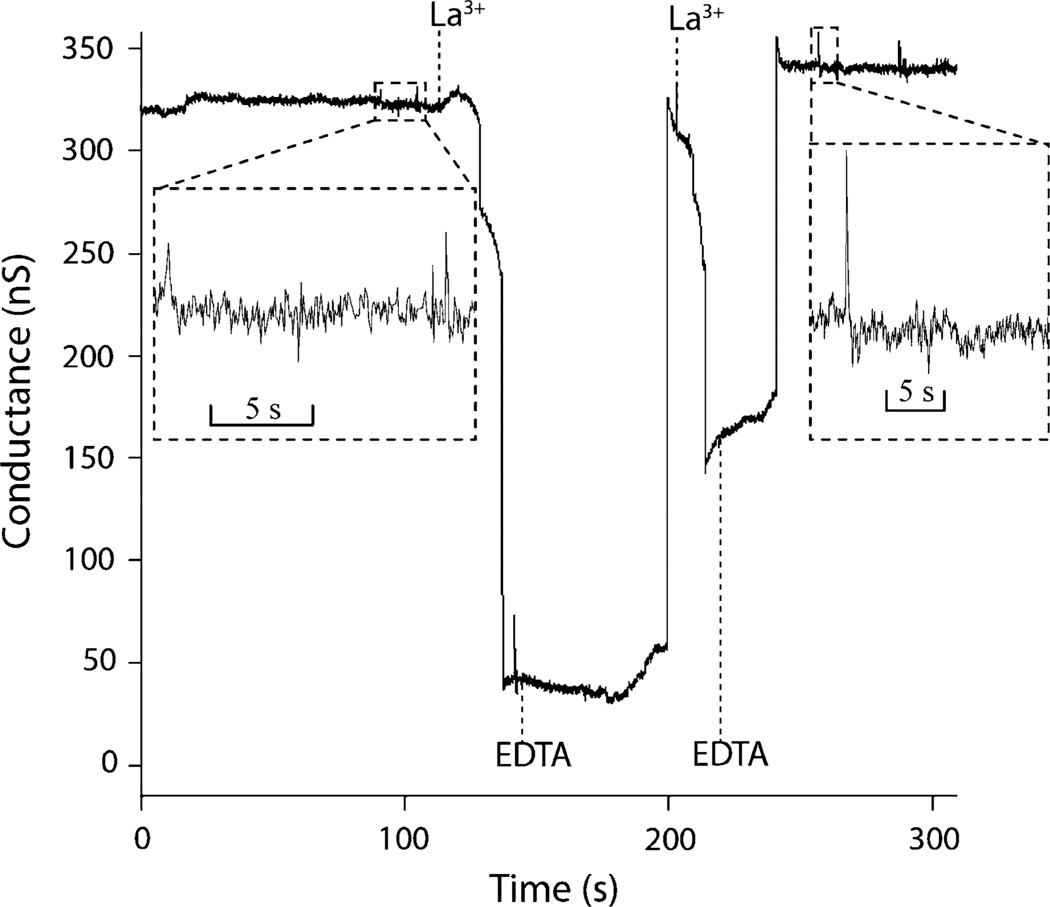
FIGURE 4.
Dynamic measurements of ceramide channel response to sequential perfusions of 50 µM LaCl3 and 50 µM EDTA. A rapid pulse flow rate of 20 µL/min was used, with a corresponding switching time of τ = 5.8 s (aperture diameter ~60 µm). The time interval between arrival and removal of each injection is estimated as 33.8 s for first LaCl3, 57.9 s for first EDTA, and 16.2 s for second LaCl3. The insets show the sub-second details of ceramide channel activity before and after two cycles of inhibition and recovery.

